Te Ōhanga Māori 2023: A Comparative Economic Overview
The Te Ōhanga Māori 2023 dashboard offers a detailed economic assessment between 2018 and 2023, highlighting key metrics such as Māori population growth, asset base expansion, and GDP contribution. This data reflects significant economic progress with a 14.4% increase in population and an 83.1% upsurge in the Māori asset base. A significant highlight is the Māori production GDP, which surged 87% from $17 billion to $31.8 billion between 2018 and 2023. Furthermore, the Māori contribution to New Zealand’s income, expenditure, and production measures has steadily grown. The dashboard also provides an industry-wise breakdown of Māori assets, showcasing progress in agriculture, real estate, and professional services. By leveraging this information, Businesses, employers, and self-employed professionals can identify investment and economic opportunities. For those tracking the Māori economic development, this interactive dashboard is an excellent resource for economic researchers, policymakers, and investors.
Te Ōhanga Māori 2023: Assets & GDP Comparison (2018 vs 2023)
The key Māori economic statistics
- From 775,836 in 2018 to 887,493 in 2023, the Māori population increased by 14.4%. In 2023, 70% of Māori were of working age with a labour force participation rate of 69%.
- The unemployment rate is 9%, which was previously at 11%.
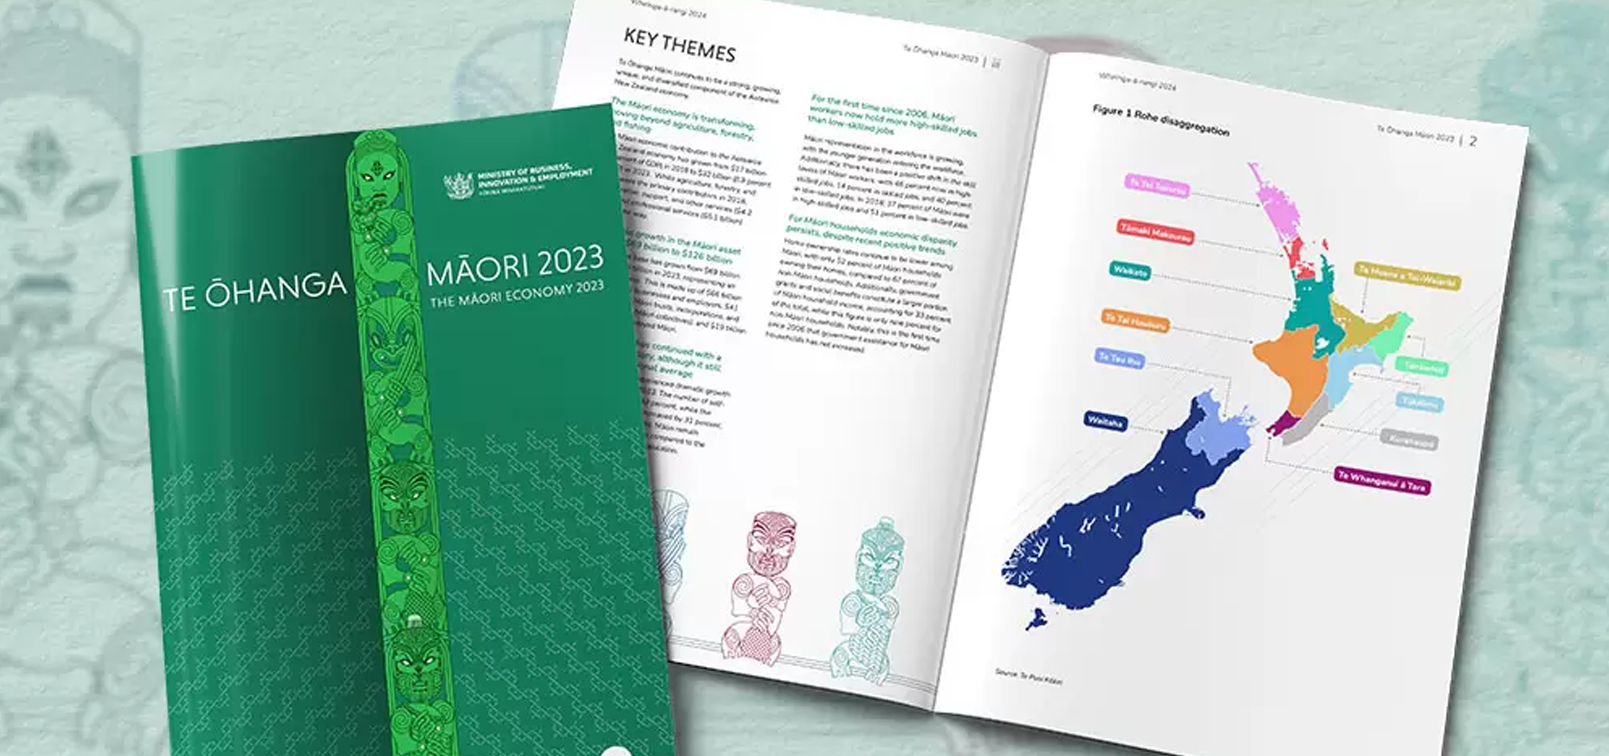
- Regional asset distribution reveals Tāmaki Makaurau and Waikato as leading contributors, while professional services, real estate, and agriculture drive Māori GDP contribution.
- Employment trends indicate that construction, manufacturing, health care, and education are major sectors where Māori are primarily employed.
- Māori assets have grown significantly across primary industries, construction, and services.
Māori Households: Income and Home Ownership Trends
Māori households in Aotearoa, New Zealand, provide homeownership rates and employment income. Employee earnings remained relatively stable, indicating employment resilience despite economic shifts.
Key insights for Māori Households identified as
- The homeownership rate varies across regions, with Kurahaupō and Te tauihu leading at 60%, while T ā maki Makaurau lags at 41%.
- Employment income differs based on job type, with self-employed individuals generally earning more. Te Tai Tokerau, self-employed Māori earn up to $62K, compared to $53K for employees.
- T ā maki Makaurau reports the highest self-employment earnings at $104K, reflecting the excellent entrepreneurial environment.
- Positive shifts in homeownership and employment income have been observed since 2018. with Te Tau Ihu leading at 54% in 2018; the highest home ownership is now at 60% for Kurahaupō.
- T ā maki Makaurau remains the lowest at 42%, signalling persistent housing affordability challenges.
- Employment income trends reveal an upsurge in self-employment earnings. In 2023, T ā maki Makaurau’s self-employed Māori earned $104K; for 2018, the highest figure was $82K. Similarly, Te Moana o Toi-Waikato saw an improvement of $78K in 2023, which was $60K in 2018.
Māori-Owned Businesses: Economic Insights
A detailed snapshot of Māori-owned businesses across New Zealand highlights the growth of Māori entrepreneurship, showcasing key sectors driving economic activity and areas needing further support.
Top Māori-Owned Business Sectors:
- The construction industry dominates with 5,862 enterprises.
- Agriculture, forestry, and fishing follow in second place with 4,869 enterprises.
- Professional services rank third with 3,112 enterprises.
- Public administration and mining have the lowest presence.