Power BI vs Tableau is one of the most common comparisons for organisations evaluating business intelligence platforms. Both tools offer powerful analytics and reporting capabilities, but they differ in visualisation flexibility, cost, integration options, and enterprise adoption.
Choosing the right Business Intelligence (BI) platform is a strategic decision. It affects how your organisation collects, analyses, and communicates data. Two dominant players — Microsoft Power BI and Tableau — offer powerful capabilities, but they serve businesses in different ways.
We have tried to provide a structured comparison to help you determine which tool aligns with your operational needs, technical capacity, and long-term data strategy.
1. Understanding Your Business Objective
Before comparing features, clarify your goal, which will apparently narrow down your need:
- Do you need structured dashboards for executive reporting?
- Do you require deep exploratory analysis for complex datasets?
- Is cost efficiency a priority?
- How mature is your organisation’s data infrastructure?
Your answers shape the right choice more than the tools themselves.
2. Ease of Adoption and User Base – Power BI vs Tableau
Power BI
- Familiar interface for teams using Microsoft products.
- Strong integration with Excel, Azure, and SQL Server.
- Faster onboarding for non-technical users.
Tableau
- Intuitive drag-and-drop interface.
- Designed for analytical flexibility and visual storytelling.
- Requires a stronger analytical understanding for advanced use.
Expert insight:
If your workforce is already embedded in Microsoft systems, Power BI reduces friction. If your analysts prioritise exploratory analysis and interactive dashboards, Tableau provides greater creative control.
3. Data Visualisation and Analytical Depth – Power BI vs Tableau
Power BI excels at KPI tracking, financial summaries, and operational reporting. It is efficient for recurring, structured insights.
Tableau is widely recognised for advanced visualisation capabilities. It excels in uncovering patterns, enabling users to interact with data dynamically and build compelling visual narratives.
Choose Power BI for reporting efficiency. Choose Tableau for analytical discovery and storytelling.
4. Cost and Scalability – Power BI vs Tableau
Power BI is generally more cost-effective, particularly for small and medium-sized enterprises. Its pricing structure makes enterprise-wide deployment financially accessible.
Tableau is the first choice for organisations that prioritise analytical depth and flexibility over budget constraints, though it involves higher licensing costs. Cost should not be the sole decision factor, but surely it significantly influences scalability.
5. Governance and Enterprise Integration – Power BI vs Tableau
Power BI integrates seamlessly within Microsoft-based governance frameworks, making it attractive for structured IT environments.
Tableau supports enterprise deployment as well, though it may require more deliberate configuration depending on the infrastructure.
6. Critical Considerations for Decision-Makers
Keep one thing clear: no BI tool automatically guarantees better insights. The effectiveness of any platform depends on:
- Data quality
- Analyst capability
- Clear business questions
- Strong data governance
Selecting the wrong tool can slow adoption, increase training costs, or limit analytical potential. Don’t forget that selecting the right one strengthens decision-making culture.
If your organisation values affordability, Microsoft integration, and standardised reporting, Power BI is likely the stronger fit. But if your priority is advanced analytics, dynamic exploration, and high-impact visual storytelling, Tableau may offer greater strategic value.
The right BI tool is not the most popular one—it is the one aligned with your business objectives, technical ecosystem, and analytical ambition.
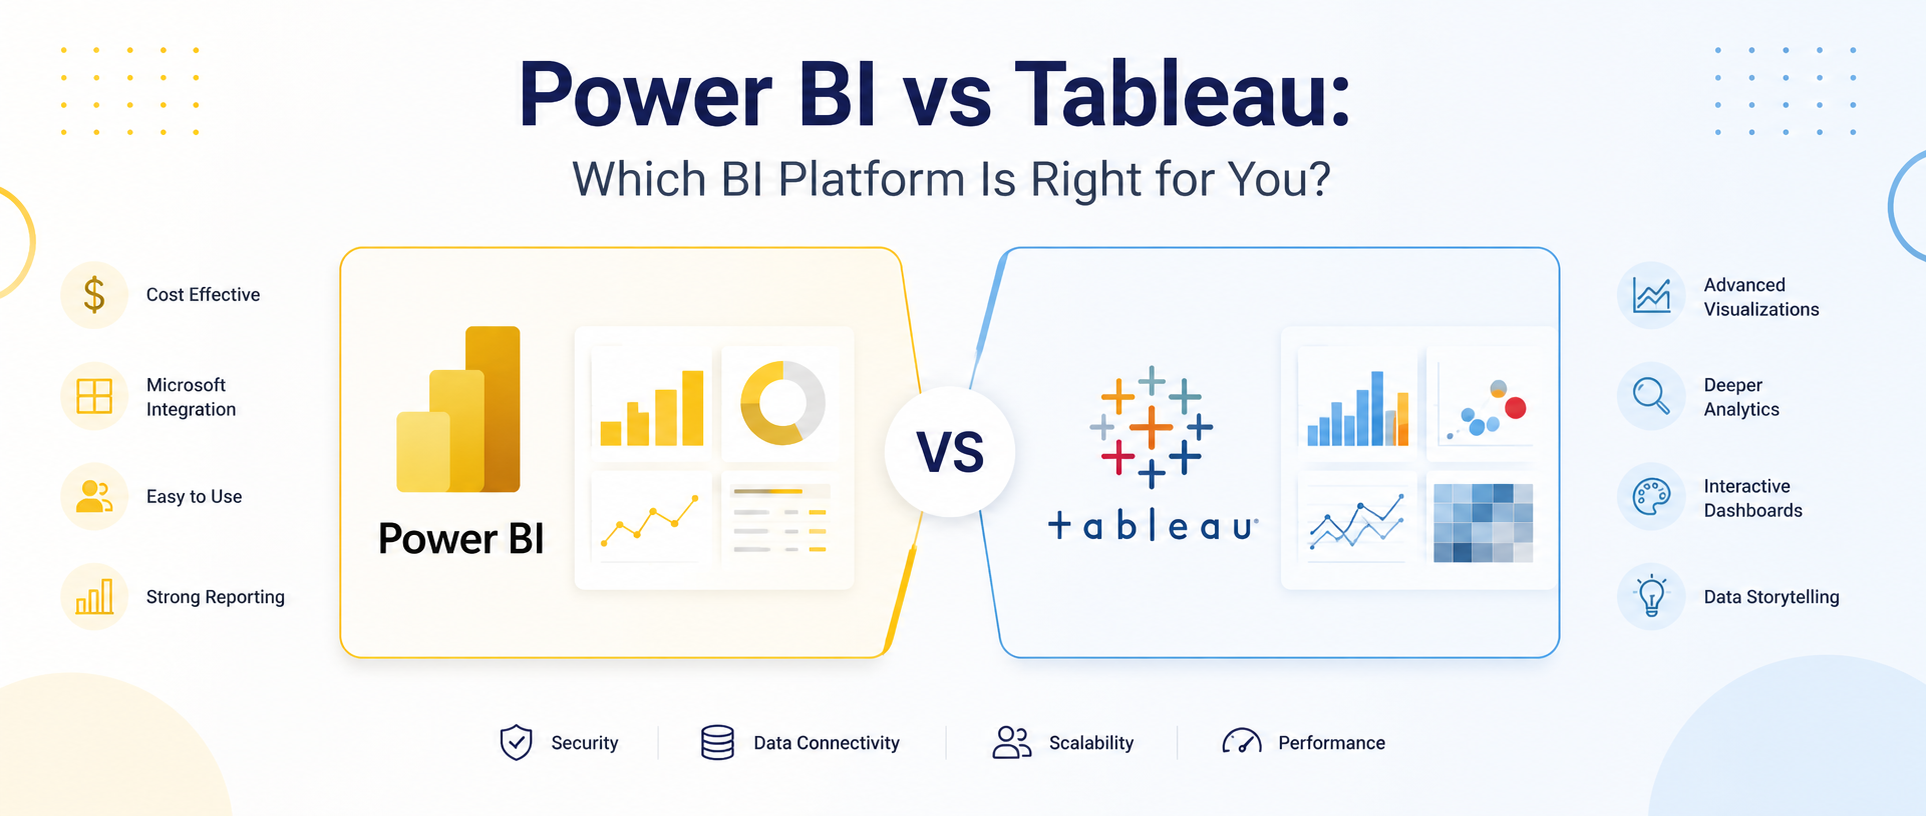
Power BI focuses on affordability, Microsoft ecosystem integration, and operational reporting, while Tableau is known for advanced data visualisation, exploratory analytics, and interactive storytelling.
Power BI is often better for organisations using Microsoft products and requiring cost-effective enterprise reporting. Tableau may be a stronger choice for teams prioritising advanced analytics and visualisation flexibility.
Power BI is generally considered easier for beginners, especially for users familiar with Microsoft Excel, Azure, and other Microsoft technologies.
Organisations choose Tableau for its powerful visualisation capabilities, interactive dashboards, and ability to uncover insights through exploratory analysis.
In many cases, Power BI offers a lower total cost of ownership, making it a popular choice for small and medium-sized organisations as well as enterprise deployments.
Yes. Some organisations use Power BI for operational reporting and Tableau for advanced analytics and data storytelling, depending on business requirements.
The decision should be based on business objectives, existing technology investments, reporting requirements, user capabilities, governance needs, and long-term analytics strategy.